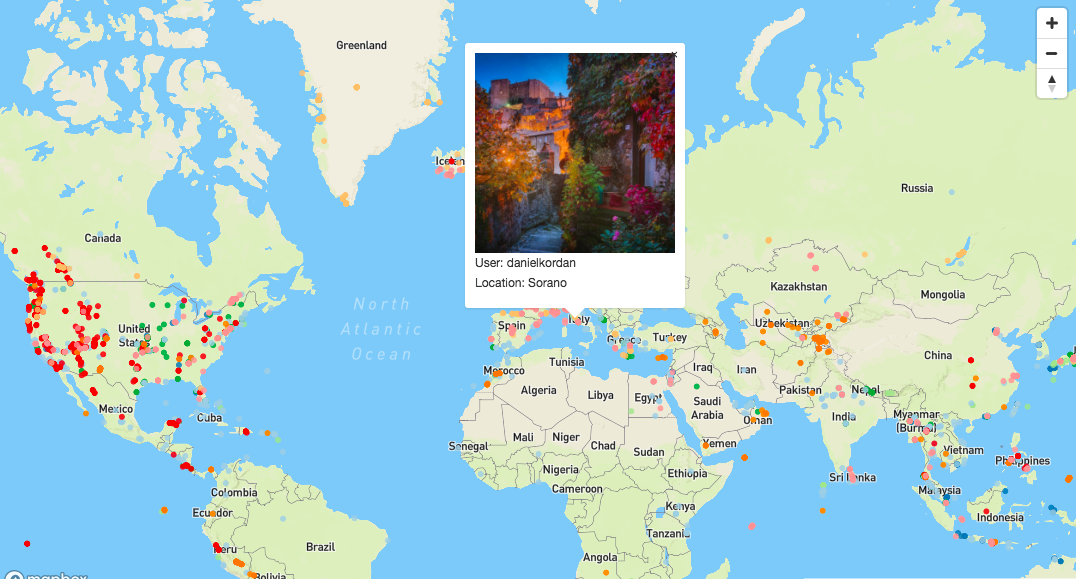
Mapbox Bucket List
Performed data preparation using Instragram and Google Maps APIs.
Create a world map using Mapbox and Leaflet.
Add tooltips with flippable images using D3.
#Python #Mapbox
Bookclub
Scrap data from Good Read API using requests.
Store and interact with data using PostGres/SQLAlchemy/Flask.
#Python #Bootstrap
Software Internships Trends at Waterloo between 2010 to 2013
Performed data preparation on 2392 students and 3560 companies between 2010 to 2013 using Python (pandas).
Built some quick visualizations of the data using R and Excel.
Built an interactive force layout chart with D3.js.
Collected company information from Glassdoor using Python (Selenium, Requests).
Use GLM to predict which companies to apply based on each company's score.
#Python #R #Excel #D3.js
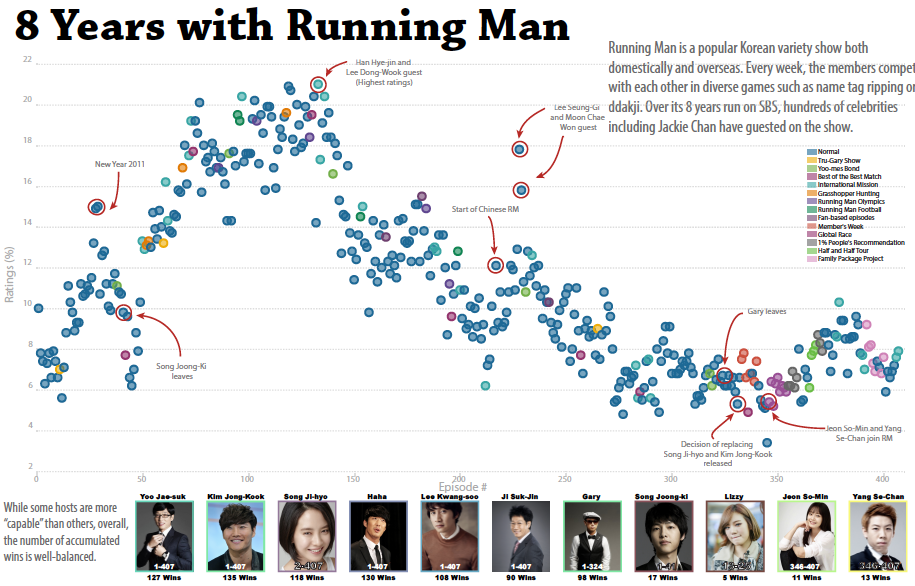
Infographic of Korean show Running Man
In summer 2018, I got obsessed with the Korean variety show and global sensation Running Man. Here is a a closer look at it's popularity over its 8 year run. (interactive charts here).
#Illustrator #Flourish
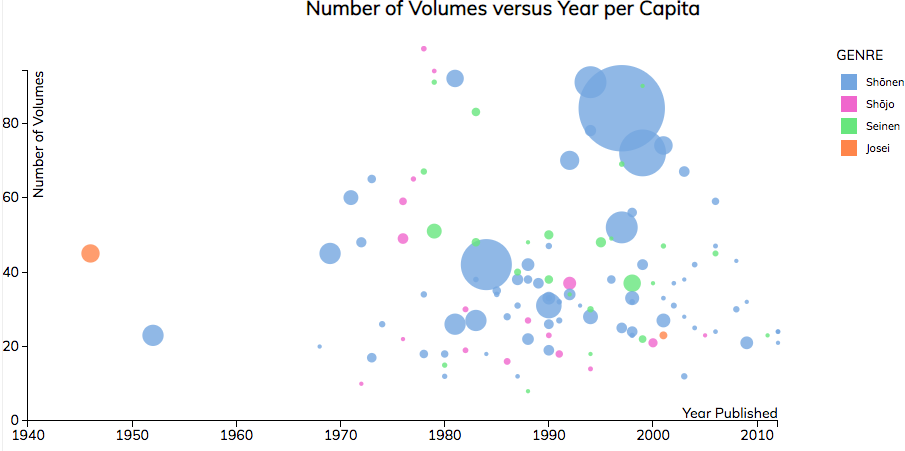
Best Selling Mangas between 1948 to 2012
Performed data scraping on the 124 best selling mangas between 1948 to 2012 using BeautifulSoup in Python.
Built a simple scatter plot using D3.js.
Built an interactive bubble chart with D3.js with external img from Mangapark.
#Python #D3.js
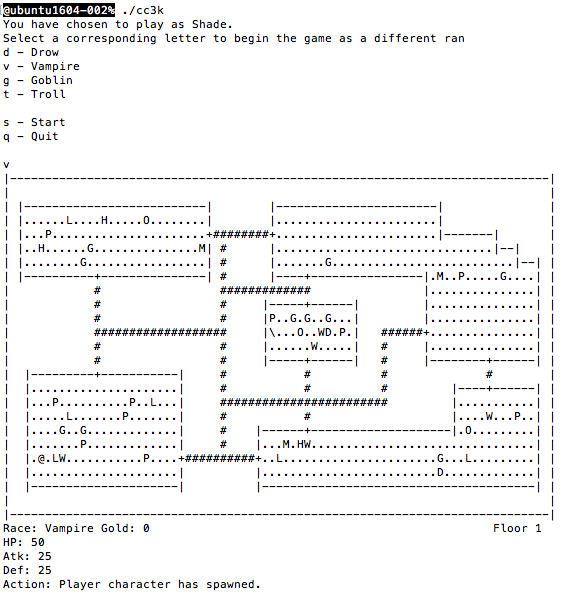
ChamberCrawler3000 Linux Game
Project completed for CS246: Object Oriented Programming course at University of Waterloo in 2017. Code and project not available.
Teammates: Ben Koczwara and Amy Sun.
#C++ #OOP